- Introduction
It’s a store that sells one-of-a-kind stuff based on Google products, culture, and characters. At the moment, there are more than 60 distinct things available for purchase, including mugs, t-shirts, purses, and backpacks.
- UX, Accessibility & Social Listening
2.1. UX
2.1.1. Strategy and Scope
User Needs and Product Objectives are two factors that are considered in the strategy pane.
User Needs
Nike, Adidas, and Google Merchandise stores share similar user needs such as being able to browse and purchase products offered by the brand, view and track order history, and be able to contact the brand for support and service requests.
Product Objectives
Nike, Adidas, and GMS have similar project objectives. All 3 websites have the objectives of listing the products on offer, offering secure checkout and payment facilities, facilitating order tracking, and providing customer care and related service requests.
To fulfill user needs and provide a satisfactory user experience, it is important to consider user segmentation.
Nike and Adidas have a more prominent user segmentation as Male (Adult), Female (Adult), and Kids. Almost all products displayed on the website are categorized by the above 3 segments. However, the Google Merchandise store does not show a clear user segmentation. Only apparel products are categorized as Male and Female.
Nike and Adidas websites both have different user journeys based on the user segment. Ex: Selecting “Women” from the top menu would filter out items relevant for women only. This gives a more focused user experience when using the Nike and Adidas websites.
However, GMS provides the same user journey regardless of the user segment. This makes the user journey complicated and cluttered for all segments of users. Therefore, it is safe to conclude that a lack of clear user segmentation and tailored user journeys make the GMS lag behind Nike and Adidas in terms of UX Strategy and Scope.
2.1.2. Structure
4D interaction design theory will be used to assess the essential aspects of a website. To reach business goals, all organizations must determine the integration between consumers and products provided on a website platform.
- 1D Words: the physical appearance of words.
- 2D Visual: how visual elements communicate with one another.
- 3DPhysical & Space: the technologies accessible to consumers.
- 4D Time: the time a consumer is willing to spend on a website.
| Nike | Adidas | Google Merchandise Store (GMS) | |
1D Words | Nike has highlighted a few CTA buttons on the website such as “Shop”, “Promo Terms”, “Shop Dance”, and “Explore”. | As shown in appendix 07 and appendix 08 the CTA button “Shop Now” keeps things easier and straightforward for the user and is a good strategy to assist users in completing their tasks on your website. The CTA button is shown differently by using a color and font that stands out from the background, giving the user a clickable feel. | GMS homepage does not highlight the call to action button “Shop Now” by color or font and this does not add a sense of urgency for the users when visiting the website using a desktop compared to Nike and Adidas. |
2D Visual | (shown in Appendix 06 – Nike Product Page)White background with black lettering and bright and colorful images. Videos/Images showing a user using the products | (shown in Appendix 09 – Adidas Product Page)A white background with black lettering and bright and colorful images. Images/Videos showing a user using the products | (shown in Appendix 03 – Google Merchandise Store Product Page)Images appear too large on the website. The image of the product goes along with the textual description.Keeping it straightforward by using only photographs on a white backdrop. |
3D Physical & Space | When used on a mobile the website has more user-friendly features than when used on a desktop. | ||
4D Time | Average Visit Duration 03.44 mins. | The average spent time on all devices is 3:13 min | The average spent time on all devices on GMS is 1:26 mins according to a similar web. The average number of pages viewed is 3.75. |
As per the above findings, it could be concluded that GMS lags behind Adidas in terms of the placement of CTA Buttons given that GMS does not highlight CTAs either by font or color. In contrast, the Adidas homepage displays a “Shop Now” CTA button that is highlighted by both font and color. However, it is noteworthy that the Nike homepage displayed several CTA buttons resulting in making it difficult for the user to focus on any of the CTA of the bu
Moreover, it could be identified that the average time spent on GMS is almost half of the average time spent by users on Nike and Adidas websites.
It could be identified that GMS has a responsive mobile website that performs well similar to the mobile websites of both Nike and Adidas.
2.1.3. Skeleton
| Nike | Adidas | Google Merchandise Store (GMS) | |
| Information Design | |||
| Interface Design | A highly designed product filter system. | Suitable specifications that correspond to the consumer’s demand. | The filter system is not detailed. |
| Navigation Design | Appendix 04 displays Nike’s top menu also known as the navigation bar. The navigation bar is the first touch point of a user’s interaction to be directed to certain items or categories. Nike features are a more accessible navigation bar, limiting the options to 5, reducing the risks of overwhelming the user while also having a tighter structure.To keep the navigation menu uncluttered, Nike has imputed a drop-down menu bar that helps the user to browse the item easily. | Adidas’ navigation menu bar has a similar structure to Nike’s however Adidas has 7 menu options suggesting it may not be scannable, shown in Appendix 07. Additionally, the bolded fonts used for the categories do an outstanding task of differentiating the three major ones (Men, Women, and Kids) from the more minor ones (Sports, Brands, and Release Dates). | webpage’s top menu and the webpage seem to have more menu options which make the user overwhelmed as well as the long name ‘Marketing Bundles’ in the top bar can confuse the users. The navigation is inadequate. |
2.1.4. Surface
| Google Merchandise Store (GMS) | Nike | Adidas | |
| Visual Design | A white background with black lettering and bright and colorful images | Nike is known to have more minimal movement and less distraction. Also increasing the color contrast between categories and sub-categories create a clearer position on the information. | Adidas uses moving elements, and dynamic design while also using pop-up advertising when browsing.A white background with black lettering and bright and colorful images |
2.2. Accessibility
| GMS | Nike | Adidas |
 Figure 01 – Source: Wave(2023) Figure 01 – Source: Wave(2023) |  Figure 02 – Source: Wave(2023) Figure 02 – Source: Wave(2023) | Figure 03- Source: Wave(2023) |
WAVE online accessibility testing revealed that GMS has 48 errors, 20 contrast errors, 12 alerts, 3 features, 67 structural elements, and 69 ARIA that increase the accessibility of web content, as represented in figure 01. The findings revealed that the GMS website included errors such as 4x broken page links, 13x empty headings, 5xempty buttons, and many more.
Compared to Nike and Adidas, Nike shows 11 errors, 0 contrast errors, 130 alerts, 187 features, 114 structural elements, and 1363 ARIA as represented in figure 02. Reveling that Background and foreground colors do not have a sufficient contrast ratio, 4 X Empty button, 7 X Broken ARIA reference, and many more.
As figure 03 the Adidas website passed the accessibility test with 0 errors, 1 contrast error, 1 alert, 1 feature, 5 structural elements, and ) Aria.
Therefore, it could be concluded that GMS performs poorly in terms of accessibility compared to Adidas and Nike given that GMS shows 48 errors compared to Nike having only 11 errors and Adidas having no errors.
2.3. Social Listening
Analyzing conversations and trends pertaining to a company is called social listening. These include discussions regarding the company, its competitors, and all aspects of the industry. Decisions about marketing are made using the insights from such debates. Facebook, Instagram, Twitter, and TikTok are the social media networks used to do the social listening analysis.
As seen in Figure 04 A measurement of the market share that the brand holds in relation to its competitors is called share of voice (SOV). It serves as an indicator of a brand’s visibility and how much the brand influences the conversation within the industry. Nike has a percentage of 85.6%, GMS has a percentage of 14.6% whereas Adidas has a percentage of 0% in the last 30 days.Therefore, it could be concluded that GMS has a lower authority in the merchandising and fashion business niche compared to Nike.
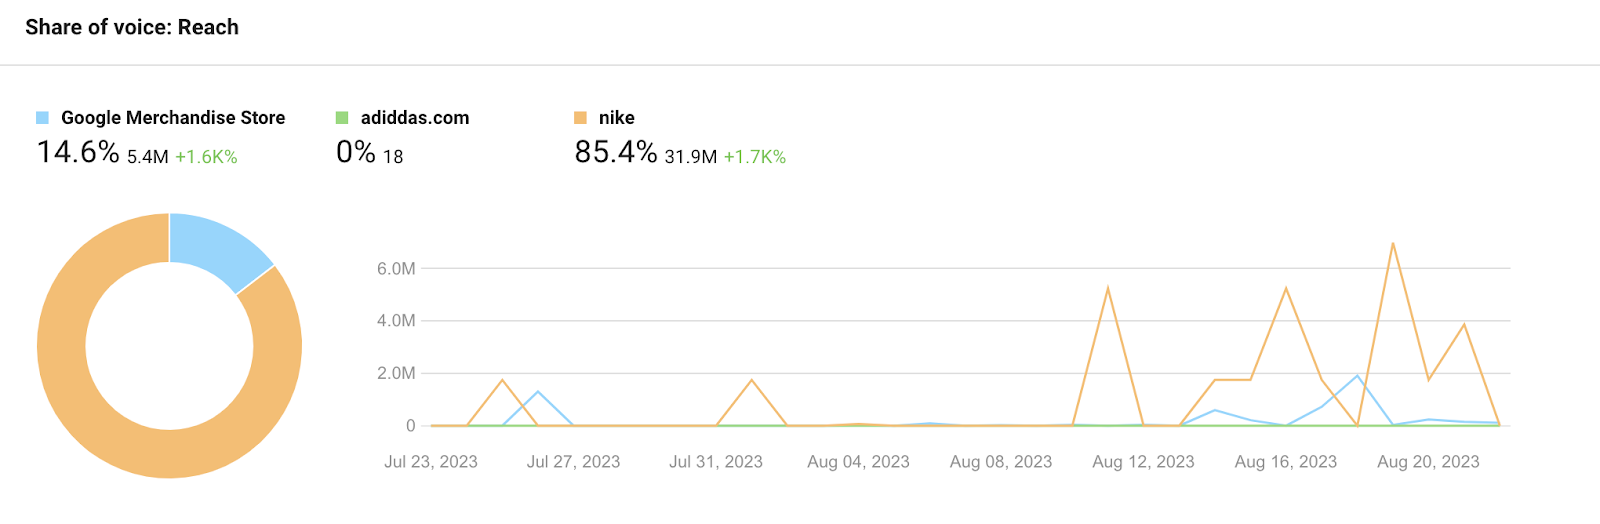
Figure 04 – Share of voice: Reach
Source: (Awario, 2023)
3.2.1. Facebook
Figure 05 Shows that Google has the lowest follower growth when compared to Nike and Adidas. However, Google has the highest post-interaction rate when compared with Nike and Adidas denoting that Google has a small yet more active fan base on Facebook compared to the other two.

Figure 05
Source: (FanPage Karma, 2023)
3.2.2. Instagram
As per Figure 07, it can be observed that Google has the highest follower growth at 0.83% which is the highest compared to Nike and Adidas. It shows that Google has been rapidly growing its Instagram follower base in recent times.

Figure 06
Source: (FanPage Karma, 2023)
Figure 07 FanPage Karma, shows the engagement rate in TikTok, Facebook, Instagram, and Twitter. As shown Nike and Adidas have the most engagement rate on Tiktok and the least on Facebook. However, according to Buzzsumo, shown in Appendix 02 Adidas’ highest engagement is on Facebook and Reddit, and Appendix 03 shows Nike’s highest engagement is on Facebook and Twitter, however, the lowest engagement for both brands is on Pinterest.

Figure 07 -Social Media profile engagement rate by platform
Source: (FanPage Karma, 2023)
As seen in figure 08, shows the best days the brands Nike and Adidas should have in order to have a good engagement. Nike, articles that were published in the UK on Thursday have an average engagement of 457, whereas Adidas articles in the UK have an average engagement of 556 when published on Tuesdays. This shows that having a specific day to post helps the brands measure how much of the audience actively engages and interacts with the content.

Figure 08 – Average engagement by day published
Source: (Awario, 2023)
- Sentiment Analysis
Sentiment analysis, often known as opinion mining, is a natural language processing (NLP) method for identifying the positivity, negativity, or neutrality of data. Organizations frequently do sentiment analysis on textual data to track how consumers think of the brands and products they produce in customer reviews and to better understand their target market (guide, n.d.). Therefore, it is necessary to monitor and gauge social sentiment in order to obtain knowledge that will enable the consumer to improve the goods and services offered by the brands. Awario, Buzzsumo, and sentiment viz the report will be used in this analysis by using real-time data and keywords related to the fashion merchandise industry such as fashion industry, fashion merchandise, etc.
Figure 09 tag cloud in Fashion Merchandise Industry. With upset in the upper left, happy in the upper right, calm in the bottom right, and unhappy in the lower left, the tag cloud depicts the most commonly occurring phrases in each of these four emotional zones. The importance of a phrase represents its frequency across all tweets in a certain emotional zone. Bigger words are used on a regular basis example words such as Adidas. A term’s color and brightness indicate how pleasant and stimulating it is thought to be for example words such as donate, move, industry, etc. The analyzed sentiment for grey words is zero since they are not recognized in our sentiment vocabulary for example words such as fashion, merchandise, leftover, etc.

Figure 06 – tag cloud (Keyword: Fashion Merchandise Industry)
Source: (sentiment viz, 2023)
Figure 09 tag cloud (Keyword: Fashion Industry)
Source: (sentiment viz, 2023)
Figure 10 sentiment for the keyword fashion industry, it is a collocation of tweets that is visualized in many ways such as by sentiment, by topic, etc. The color, brightness, size, and transparency of each circle represent distinct aspects of the tweet’s sentiment.

Figure 10 – sentiment (Keyword: Fashion Industry)
Source: (sentiment viz, 2023)
The sentimental ratio of many emojis is higher than that of words. The number of emojis or phrases used in negative vs positive Tweets, or vice versa, was used to compute the sentiment ratio. Using emojis will significantly improve the accuracy of emotion classification in social media. An example is given in Figure 11

figure 11 – sentiment (Keyword: Fashion Industry)
Source: (sentiment viz, 2023)
Figure 12 & Figure 13 a sentimental analysis that was analyzed through posts and comments by using the keyword fashion merchandise industry on different social media platforms such as Twitter, Reddit, etc.

Figure 12- sentiment (Keyword: Fashion merchandise industry)
Source: (social-searcher, 2023)

Figure 13 – sentiment (Keyword: Fashion merchandise)
Source: (social-searcher, 2023)
- Data Analysis & Dashboard Creation
3.1. Audience
3.1.1. Demographics
When considering the time period between 14th May 2022 to 14th May 2023, it could be observed that the age group 25-34 is the age group that is most visited to the Google Merchandise store to initiate at least one session. Out of the users of the 25-34, majority of the users can be identified as males which accounts for 56.99% of the visitors of that age group. Moreover, 57.87% of all users of the website are male. Therefore, it could be concluded that GMS is mostly popular among younger males compared to other age groups and genders.

Figure 14: Visitors by Age Group to initiate at least one session
3.1.2. Location and Language
The majority of the users of the Google Merchandise Store are from the United States which accounts for 39.97% of the users followed by Canada at 9.6% and India at 9.38%. The majority of the users use US English 53.66%.
3.1.3. New vs Returning Users
It could be observed that 74.33% of the visitors are New visitors while 25.67% of the visitors are returning visitors. This metric shows that GMS is not attractive enough for the majority of the users to visit again.
It can be identified that the majority of the users are direct users who bring in the highest amount of revenue. This could mean that GMS has not diversified its marketing and sales channels.
3.1.4. Browser and OS
Majority of the users can be identified as users who use “Chrome” as the browser at 78.49%. Furthermore, it can be seen that the majority of the users access the Google Merchandise Store via Desktop.
Furthermore, the majority of the users use Windows OS to visit Google Merchandise Store followed by Macintosh users as the second highest.

Figure 15: Audience by Browser

3.2. Acquisition
3.2.1. Channels
Majority of the customers of the store are direct customers which accounts for 82.67% out of all users. Around 14.43% of the customers reach the site through paid search. The highest e-commerce conversion rate is from direct users as well which accounts for 2.36%. Moreover, 90% of the revenue is generated via direct searches as well. Referrals had the highest number of pages per session and the highest average session duration.
3.2.2. Keywords
The most used keyword to reach Google Merchandise Store via Google Ads is “Google Merchandise Store” which accounts for 11.46% of all the keyword searches which is followed by the term “hoodies” which accounts for 6.43% of the clicks.

Figure 17: Word Cloud of Most Used Keywords
3.2.3. Devices
Users accessing from the desktop have taken the highest number of impressions which is 56% of the total number of impressions. Desktop users also have the highest number of clicks which is 49.7% of the clicks. Mobile users have come in second followed by Tab users.
3.3. Behaviour
3.3.1. Site Content
Highest number of page views are on the homepage of Google Merchandise Store. The homepage has the highest number of entrances as well at 45.12%. Google+Redesign/Apparel page is the second most popular landing page after the homepage. While the homepage has a session duration of 02 minutes 47 seconds, the Google+Redesign/Apparel page has an average session duration of 03:00 seconds.
Moreover, the homepage has a bounce rate of 50.77%.
The homepage also has the highest exit percentage at 31.03%. This would mean that the homepage is not convincing enough for users to browse rest of the website.
3.3.2. Site Speed
Internet Explorer has the lowest page load time which is 2.83 seconds. Chrome has the second lowest page load time which is 4.14 seconds. Bermuda is the country with the lowest average load time at 1.52 seconds. Lebanon has the second-lowest page load time at 1.96 seconds.
Figure 18: Average Page Load Time based on Browser
3.4. Conversions
3.4.1. E-Commerce Overview
“Google Unisex Eco Tee Black” has been the top-selling product of the Google Merchandise Store generating a revenue of USD 57,359 which is 2.34% of the total revenue. This is followed by the “Google Black Eco Zip Hoodie” which is 1.85% of the total revenue. The average value for the time period considered is 99 USD.
“Apparel” is the product category that has the highest product revenue which is 36.5% of the total revenue. The “View All-Campus Collection” product has generated the least amount of product revenue at 0.73% of the total revenue.
When considering the product list performance, the products that appear on the “Search Results” have had the highest product list views.
4. Strategic Recommendations
Site Loading Time
Google Analytics data shows that the Google Merchandise Store has a high average loading time. It can be seen that it takes over four seconds for the website to load on Chrome which is considered to be the most widely used browser. The Google recommended page load time is under two seconds (Camarena, 2023). Therefore this could be identified as a major performance issue that could drive potential users away. Hence it is important to work on improving site loading time to bring it under two seconds which is the Google recommended page load time. It is said that as the load time goes from 1 second to 5 second the bounce probability increase by 50% (An, 2018).
Several strategies can be implemented to decrease the website loading times. One of the major that could be done is optimizing the images with appropriate format. It is established that GIF is ideal for images with a few colors ( ex: images that are used as logos), JPEG is considered to be ideal for pictures with a lot of color and detail to represent, while PNG is considered best for high-quality images that need a transparent background (Adobe, 2023).
Another tactic that could be utilized is compressing the content on the site via methods such as HTTP compression. Furthermore, Javascript and CSS files can be compressed which will reduce the size of the source code (WP Rocket, 2023).
Caching the website could also be a useful tactic in increasing the site loading time (An, 2018).
Diversify Marketing Channels with Social Media
Google Analytics data shows that an overwhelming majority of visitors to the website are direct users. This shows a lack of diversification of marketing channels. GMS could expand and diversify its marketing channels by including other channels such as social media.
It could be identified that the presence of Google Merchandise Store in Social Media is comparatively low compared to its competitors. However, Social Media presence could be a major driver of potential customers to an e-commerce store.
Therefore, it is important that Google Merchandise Store makes an effort to maintain a consistent and engaging social media presence. This could be achieved by posting on social media regularly and engaging with users through activities such as polls, giveaways, etc. In addition to that it is important to create creative content that has the potential to achieve a viral reach.
Include a Blog to Increase Website Engagement
Google Analytics data shows that 74.33% of the visitors are New visitors while 25.67% of the visitors are returning visitors. One major tactic that can be used to attract more returning users to the website is to include a blog on the website so that users keep returning to the website to read blog updates. A blog could also act as another sales /marketing channel for GMS products.
`Website Navigation
As explained through the UX Analysis, it could be identified that the navigation menu of the Google Merchandise store is complex to use compared to its competitors. This could be improved by implementing a navigation menu by reducing the number of categories and subcategories.
- References
Adobe. (2023, 07 20). GIF files: How to create, edit and open them. Adobe. Retrieved August 22, 2023, from https://www.adobe.com/creativecloud/file-types/image/raster/gif-file.html
An, D. (2018). Page load time statistics. Think with Google. Retrieved May 18, 2023, from https://www.thinkwithgoogle.com/marketing-strategies/app-and-mobile/page-load-time-statistics/
Camarena, A. (2023, March 7). What Is Page Speed & How to Improve It. Semrush. Retrieved August 22, 2023, from https://www.semrush.com/blog/page-speed/
Craig, W. (n.d.). 10 Tips for Decreasing Web Page Load Times. WebFX. Retrieved May 18, 2023, from https://www.webfx.com/blog/web-design/decrease-webpage-load-times/
Garrett, J. J. (2023, – -). THE ELEMENTS OF USER EXPERIENCE. THE ELEMENTS OF USER EXPERIENCE. Retrieved May 16, 2023, from http://www.jjg.net/elements/pdf/elements_ch02.pdf
guide, s. (n.d.). Sentiment Analysis Guide. MonkeyLearn. Retrieved May 16, 2023, from https://monkeylearn.com/sentiment-analysis/
Krishan, K. (2022, April 30). Accessibility in UX: The case for radical empathy. UX Magazine. Retrieved May 16, 2023, from https://uxmag.com/articles/accessibility-in-ux-the-case-for-radical-empathy
Porter, J. (2011, August 2). The Button Color A/B Test: Red Beats Green. HubSpot Blog. Retrieved August 21, 2023, from https://blog.hubspot.com/blog/tabid/6307/bid/20566/the-button-color-a-b-test-red-beats-green.aspx
Usability.gov. (2022, – -). User Experience Basics. Usability.gov. Retrieved May 16, 2023, from https://www.usability.gov/what-and-why/user-experience.htmlWP Rocket. (2023, 08 20). How to Minify CSS and JavaScript in WordPress. WP Rocket. Retrieved August 22, 2023, from https://wp-rocket.me/google-core-web-vitals-wordpress/minify-css-javascript/